Reporter for Cisco Firepower
Installation guide
Fastvue Reporter can be up and running in as little as five minutes following this simple installation guide.
Minimum Server Requirements
Download Fastvue Reporter and install on a machine (or virtual machine) that meets our recommended requirements below.
Installation
Note: In order to import data and run reports as fast as possible, Fastvue Reporter can be resource intensive. We do not recommend installing Fastvue Reporter on a server that provides a critical services such as a Domain Controller, DNS server, or DFS server. We recommend installing on a dedicated VM (virtual machine) so you can scale the resources appropriately.
To install Fastvue Reporter:
Double-click the downloaded setup exe on a machine that meets the above requirements.
The installer automatically installs and configures the required pre-requisites which include .Net 4.6 and IIS (Web Server and Application Server roles). It will also install Open JDK and Elasticsearch in its own self-managed directory.
Once the pre-requisites have been installed, proceed through the installation wizard. It will ask you for:
Installation folder Only application files are installed to this folder and it does not require much disk space. The default is C:\Program Files\Fastvue\{Product Name}.
Website and Virtual Directory This is the website and sub-folder (virtual directory) within IIS to install the Fastvue Reporter website into. The default is Default Web Site. If you have other websites installed on your server, it is a good idea to either create a new website in IIS first and install to that, or use the 'sub-directory' option and enter a name such as ‘fastvue’ or ‘reports’. This creates a contained 'virtual directory' in IIS under the main website which you can access using
http://yourserver/fastvue(for example).Data Location This is the location where all imported data, configuration and report files are stored. Specify a location with plenty of disk space. The default is C:\ProgramData\Fastvue\{Product Name}.
Navigate to the Fastvue Reporter web interface in your web browser. If you are on the server you installed, this will be
http://localhostorhttp://localhost/sub-folder-nameif you specified a sub-folder in step 3 above (replacesub-folder-namewith the actual name you specified). You can also replacelocalhostwith the server's name or IP address to access the web interface from a different machine.
Upgrading
To upgrade an earlier version of Fastvue Reporter, simply run the new installer over the top of your existing installation. The installer will pick up your existing settings, so just click next throughout the wizard without making any changes. Once installed, browse to the site and clear the browser cache by hitting ctrl + F5 (cmd + R on Mac).
Note that it can take a few minutes for data to start importing again after upgrades and restarts of the Fastvue Reporter service. You can check the database initialisation progress in Settings | Diagnostic | Database.
Automated / Silent Deployment
If you need to deploy or upgrade Fastvue Reporter silently or to multiple servers in an automated way, please see our comprehensive Reporter 4.0 PowerShell script.
Configure Cisco Firepower's Syslog Settings
To configure your Cisco Firepower devices to send syslog data to the Fastvue server:
Log into Cisco Firepower Management Center (FMC) and go to Devices | Platform Settings.
Edit your Threat Defence Policy (create one if you don't have one already) and then go to Syslog on the left hand side.
Click the Syslog Servers tab and click Add.
Select your Fastvue Server in the IP Address drop down list (click the + button to create a server object for your Fastvue Server if you do not already have one).
Select TCP as the protocol (UDP will also work), and enter the port you would like to use to send and receive syslog data between the two servers. Fastvue Reporter listens on port 514 by default, so use this if no other application on the Fastvue Server is using port 514.
Under the 'Reachable by' section, choose the appropriate option based on the location of your Fastvue Server. For example, if you have installed Fastvue Reporter on a server in your LAN, then select Security Zones or Named Interfaces then select LAN in the Available Zones section and push it into the Selected Zones section.
Click OK to add the Syslog Server, then click Save, to save the Syslog Server settings.
Go to the Syslog Settings tab and make sure Enable timestamp on each syslog message is checked.
Configure logging settings for Access Policies
Once a syslog server has been configured in Platform Settings, you need to configure your Access Policies to use this syslog server.
To do this:
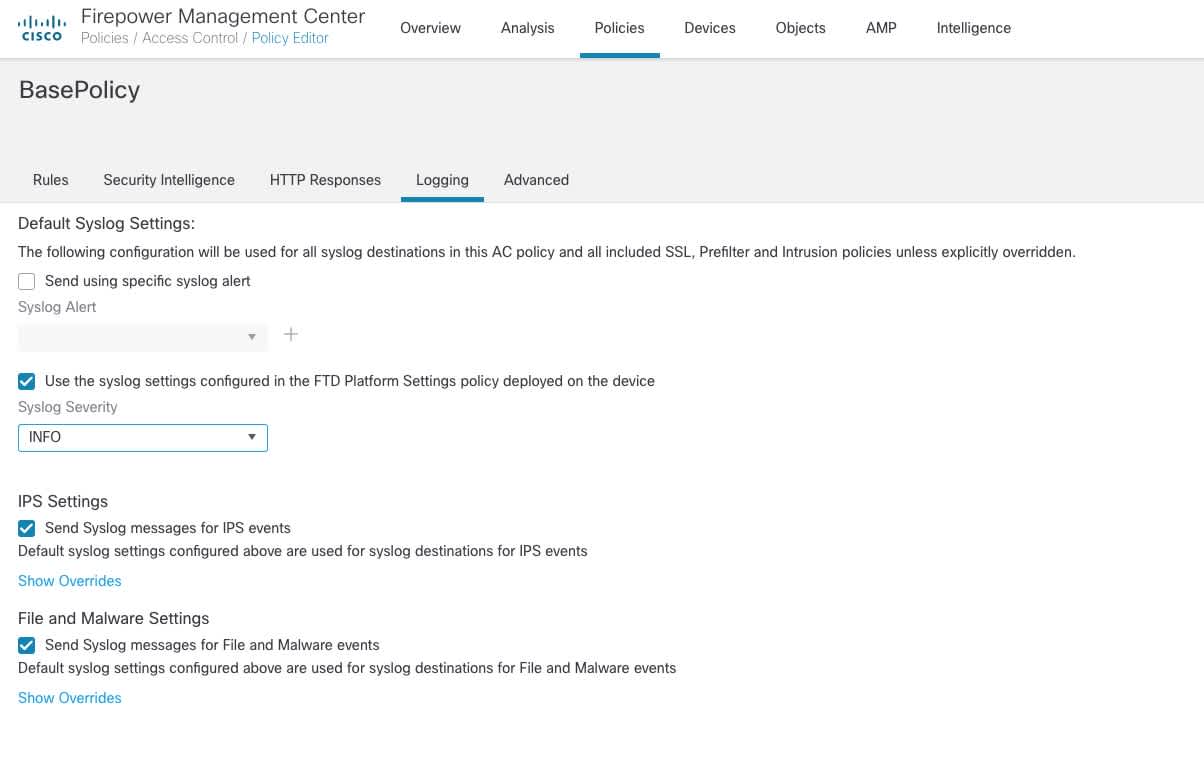
Go to Policies | Access Control and edit the Access Policy that controls the flow of traffic that you need to monitor and report on.
Click the Logging tab,
Check the option to Use the syslog settings configured in the FTD Platform Settings policy deployed on the device and set the priority to Syslog Severity to Info.
Check the option under IPS Settings to Send Syslog messages for IPS events.
Check the option under File and Malware Settings to Send Syslog message for File and Malware events.

Configure logging settings for Rules
Each individual Rule within your Access Policy also need to be configured to send syslog traffic to the syslog server.
To do this:
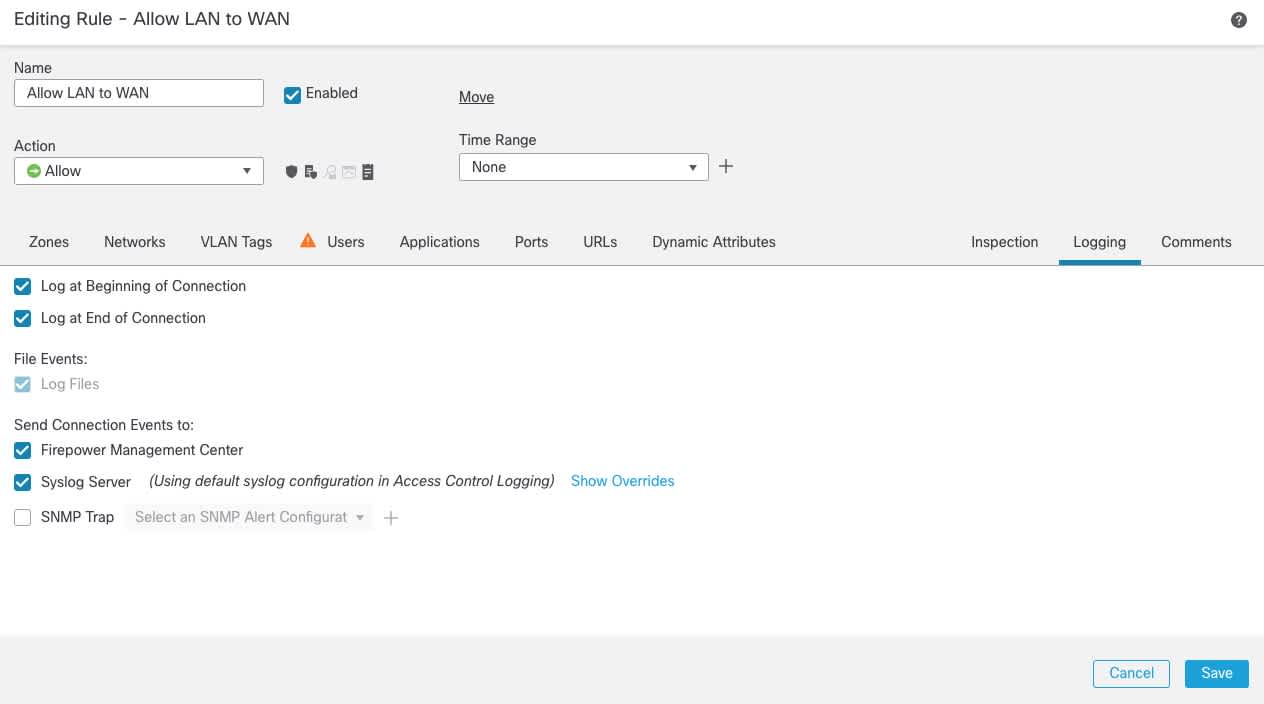
Make sure you're still editing your Access Policy above and go to the Rules tab.
Check the options to Log at Beginning of Connection AND Log at End of Connection
Under the Send Connection Events to: option, check Syslog Server.

Add a Source
Add your firewall as a Source in Fastvue Reporter. This can be done on the start page that is presented after installation, or by going to Settings | Sources and clicking Add Source.
If your firewall is sending syslog data on port 514, click into the dropdown and wait a few seconds. The dropdown will populate with the name and/or IP of the device(s) sending syslog traffic to the Fastvue Server. Simply select your firewall from the list and click Add Source.
If your firewall is sending syslog data on a different port (such as 50514 if using the Linux / Docker version), Fastvue Reporter will not automatically display your firewall in the dropdown list. In this case, manually enter your firewall's IP and your selected syslog port into the options provided, then click Add Source.
Note: If entering your firewall and port manually, make sure the IP is the one your Fastvue Server is receiving syslog data from. This could be the IP of the internal LAN interface on your firewall, or if you have intermediate devices routing syslog traffic, it could be the interface IP of the last hop.
If you're unsure, you can a 'dummy' source with an invalid name (such as 'dummy') but specify the custom syslog port your firewall is sending syslog data on. Fastvue Reporter will then start listening on the port specified. You can then click Add Source again, and the dropdown list should populate with any device sending syslog data on your custom syslog port.
It may take 10-20 seconds before the first records are imported. You can watch the records and dates imported in Settings | Sources. Once records start importing, you can go to the Dashboard tab to see your network traffic.
Enjoy
Now you can try out the many features of Fastvue Reporter!